Personal website of Amit Grinson. Data Analytics & Visualizations
Blog Talks Visualizations Projects About

Defining uncertainty in the Israeli lottery

Exploring the probability of winning the lottery at and by a given trial with the Geometric distribution

By Amit Grinson in R

July 9, 2020

Learning Tfidf with Political Theorists

Learning tf-idf through political theorists.

By Amit Grinson in R

May 31, 2020

Hosting interactive graphs online

A walk through for sharing your interactive visualizations on GitHub Pages

By Amit Levinson in R maps

May 1, 2020

Israeli elections on Twitter

Analyzing tweets from the the Israeli elections week

By Amit Levinson in R

April 20, 2020

Making updating exam grades easy with R

In this post I discuss my use of the xlsx and clipr packages for optimizing how I updated students exams

By Amit Grinson in R

February 15, 2020

Visualizing Eliud Kichoge’s new marathon record

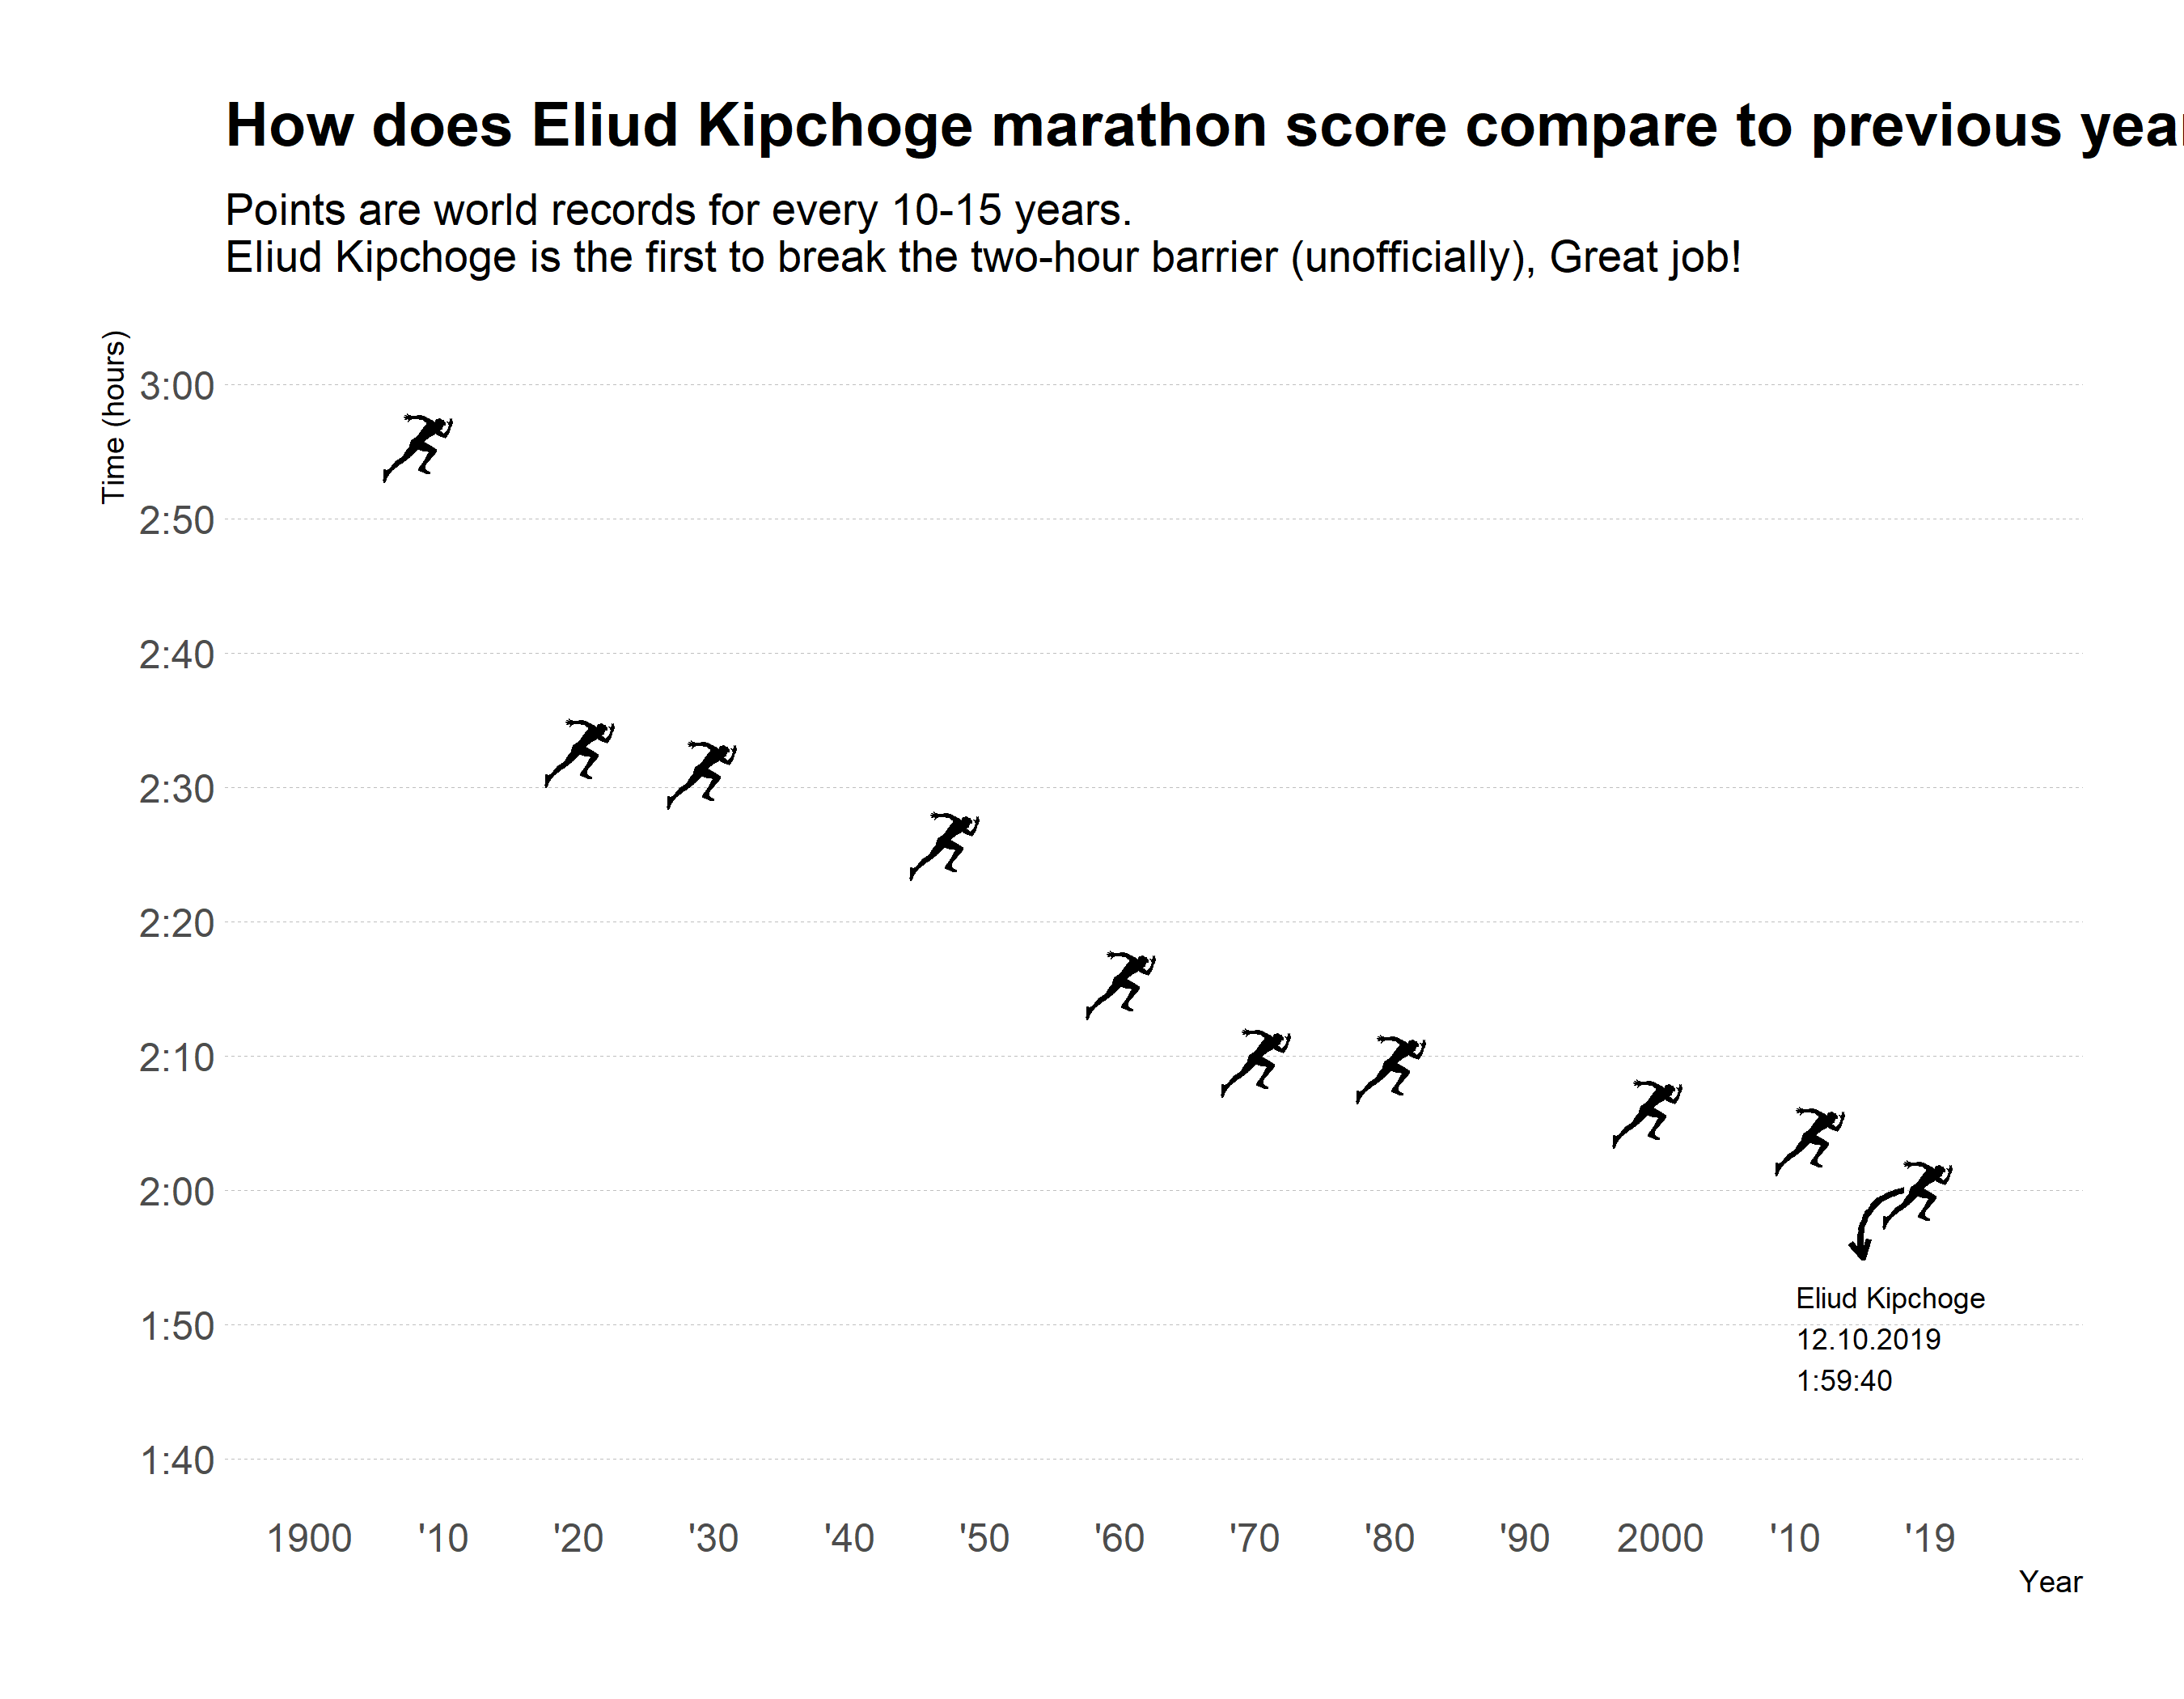
In this post I plot Eliud Kichoge new marathon record using rvest to get data from wikipedia and ggimage for plotting images as points

By Amit Grinson in R

February 7, 2020

Mapping bomb shelters in Be’er-Sheva, IL

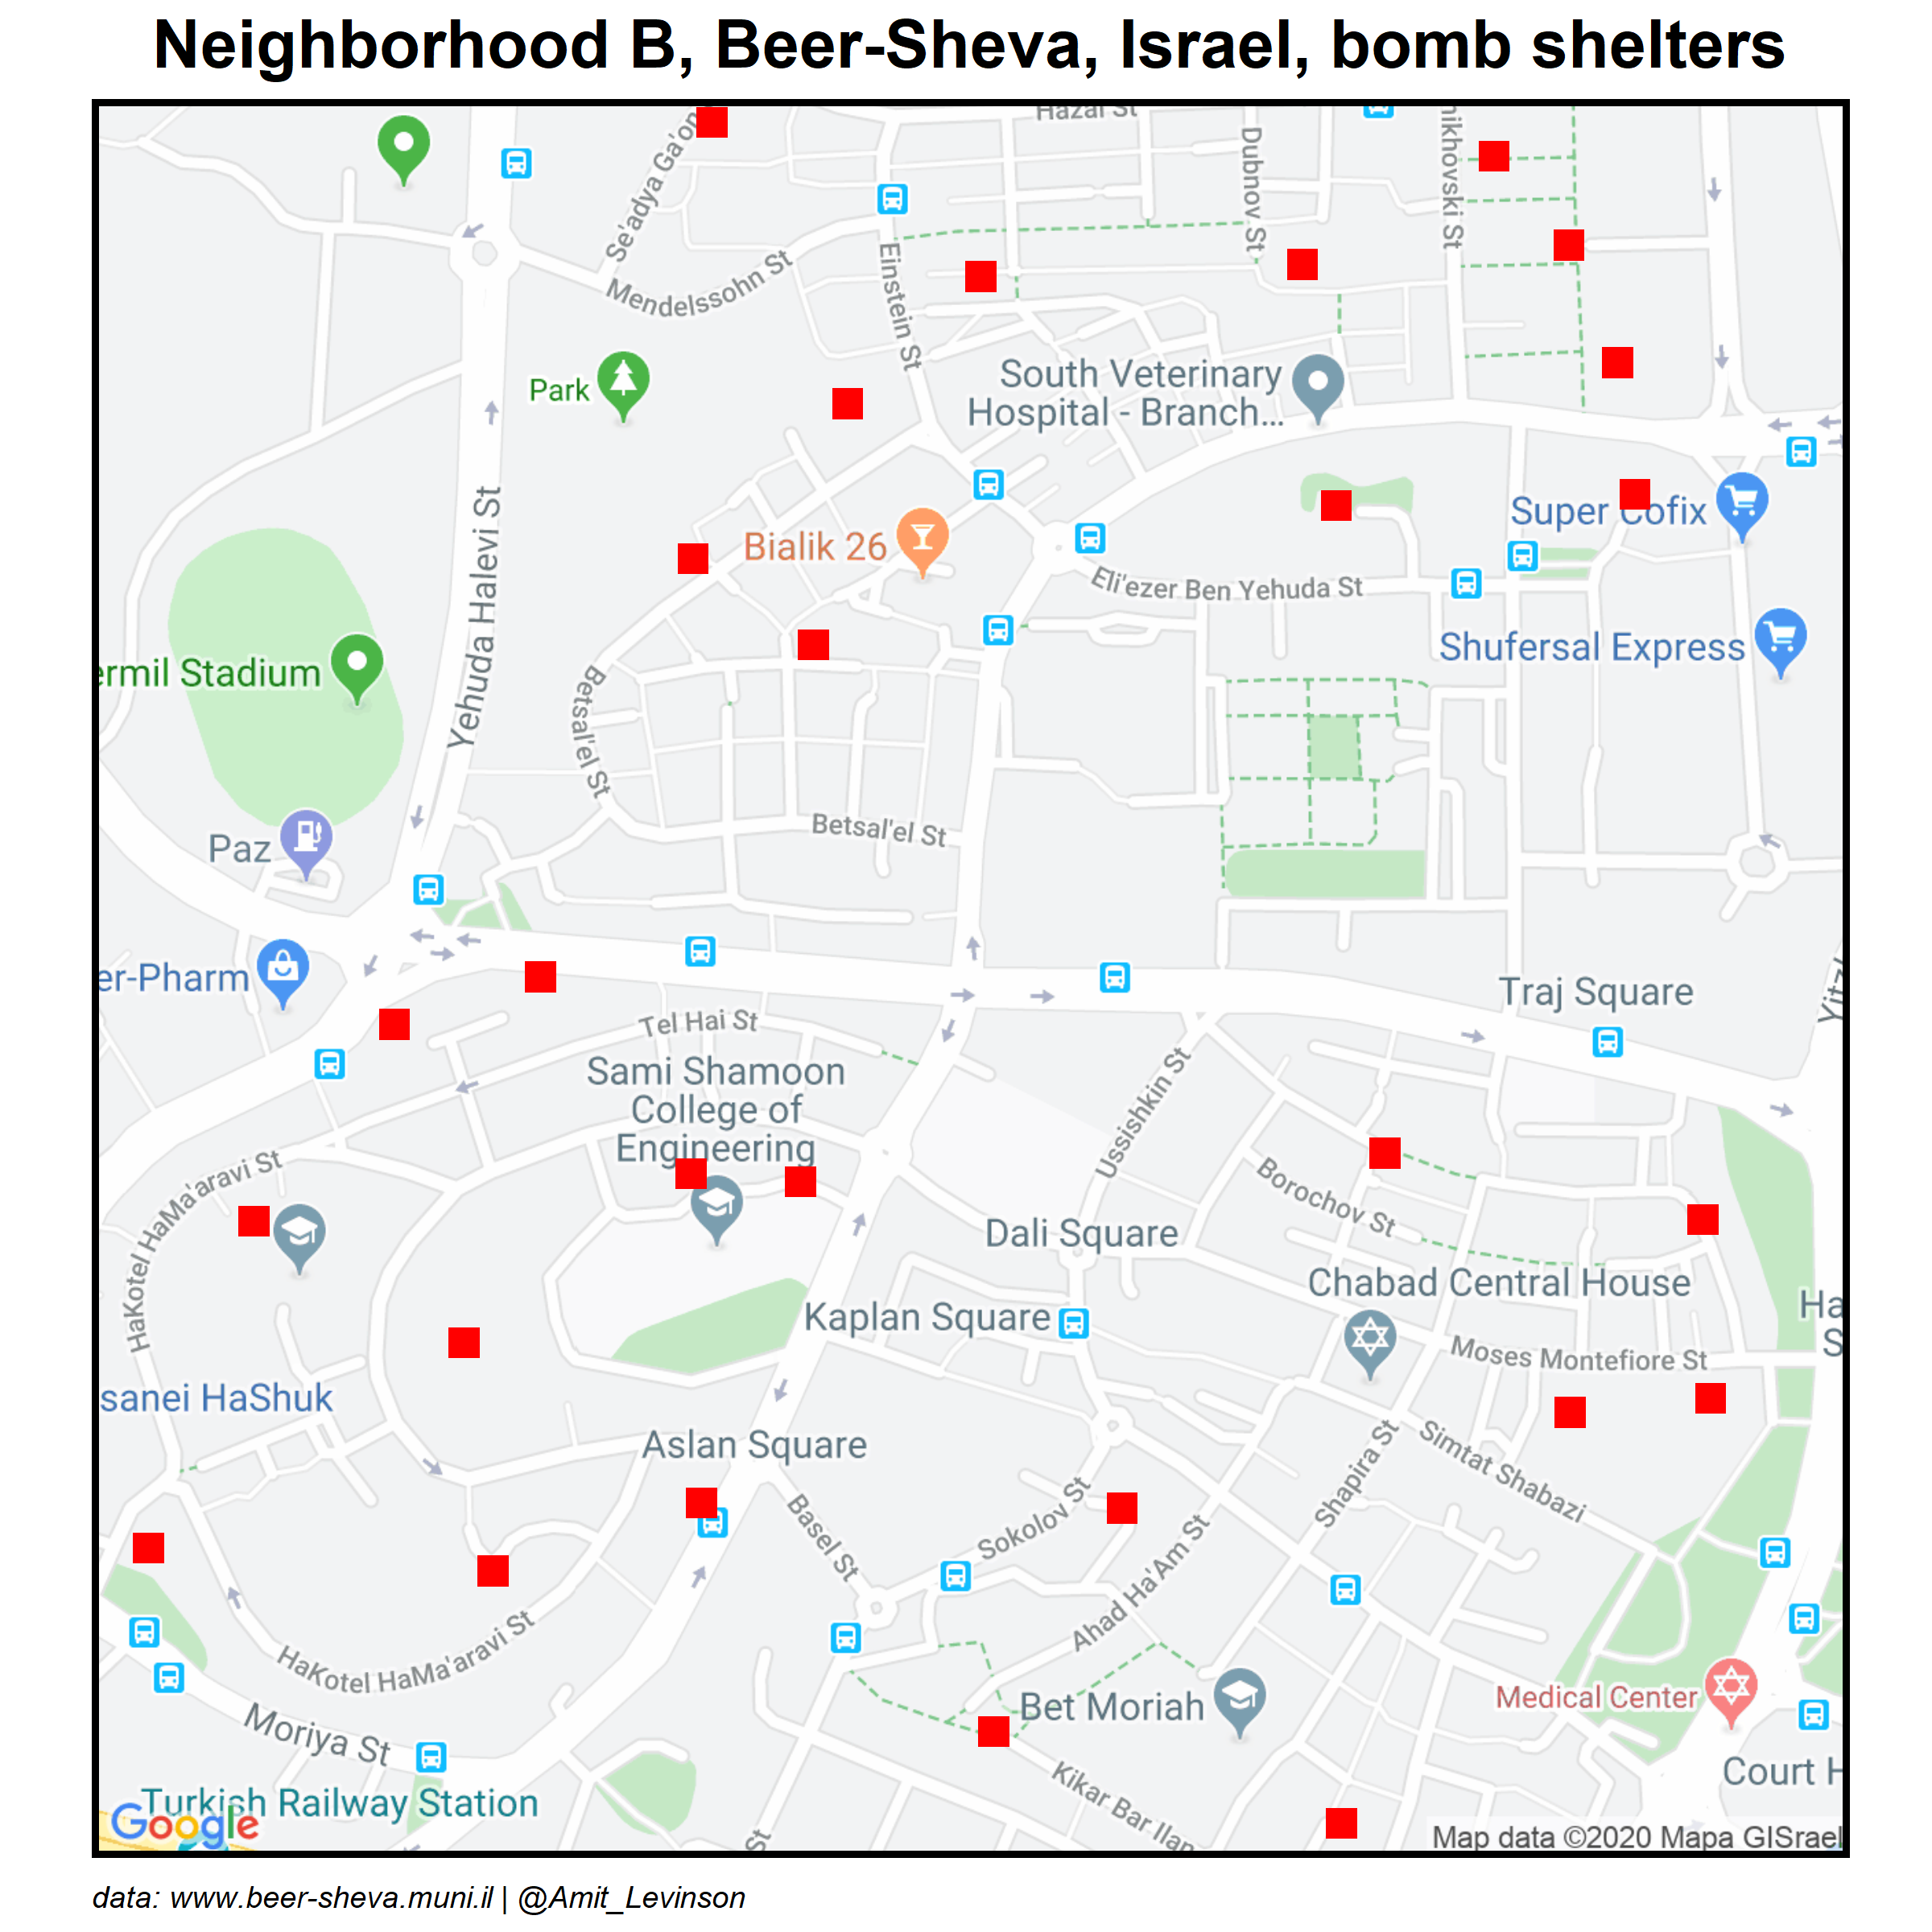
While rockets were fired towards Israel I decided to take the opportunity and plot bomb shelters in Beer-Sheva.

By Amit Grinson in R maps

January 14, 2020

  • ← Newer
  • 2 of 2
  • Older →

Blog

A place to share my thoughts, learning and challenges I overcame. You’ll mainly find here writeups about data analysis & visualizations using R, SQL and/or Python.

Written by Amit Grinson

Subscribe via RSS

Made by FormspreeFormspree is a form backend, API and email service for HTML forms. It is the simplest way to collect form submissions on your static website.

Amit Grinson Made with Hugo Apéro, &